Mapping the Distant Universe
A new technique, in combination with the powerful light--gathering
power of the new generation of ground--based optical/infrared telescopes,
is allowing one to map out the structure traced by galaxies on large
scales, when the universe was only 10% of its current age.
The simplicity and reliability of this
technique for isolating the extremely distant galaxies from among the much more
numerous foreground, less distant ones, allows true mapping of the galaxies'
large--scale distribution for the first time.

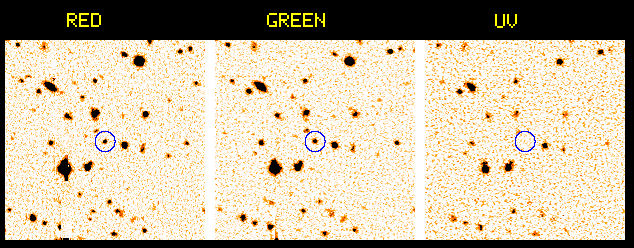
The illustration above shows a small portion of three images of the same
piece of sky, taken with the 200-inch Hale Telescope at the Palomar
Observatory in California. The images were taken through red, green, and
ultraviolet filters specially designed for finding high redshift galaxies.
The object at the center of the circle is clearly present in both the red and
the green image, but disappears in the UV image.
The characteristic UV ``dropout'', the disappearance of the galaxy in the
ultraviolet filter, is
due to absorption by hydrogen gas that can only be seen when the galaxy
is at an extreme distance, when the redshift is large enough that
the absorption edge, which occurs in the far ultraviolet, is shifted
all the way to wavelengths that are not blocked by the earth's atmosphere.
Candidate high
redshift galaxies are isolated using such images (the full-size
images contain 100-150 of these candidates) and then are confirmed
using a spectrograph on the 10-meter W. M. Keck Telescope in Hawaii.
The technique is sensitive to galaxies with redshifts in the range
2.6-3.4, or distances of about 12.5 billion light years for a
Universe 14 billion years in age.

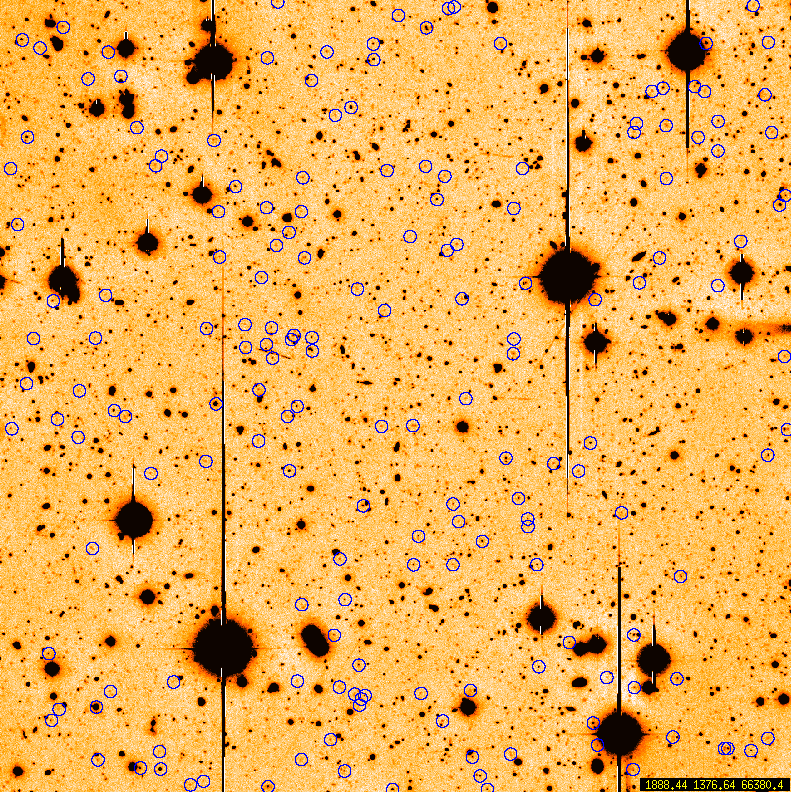
This is an example of a full image obtained with a CCD camera on the
Palomar Hale Telescope, with all of the galaxies having "ultraviolet dropouts"
circled. Spectra of these objects are then obtained with the W.M. Keck 10-meter
telescopes in Hawaii, to measure the precise redhift, or distance, to each galaxy.
There are about 4000 galaxies in the image, of which about 150 are candidate
extremely distant galaxies.

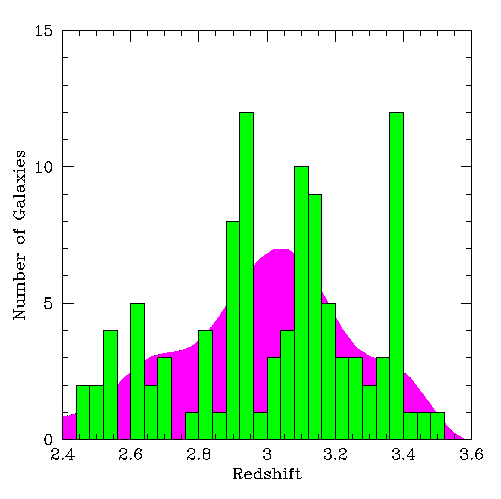
After redshifts are determined, they can be placed into "bins" in distance,
where large "spikes" indicate significant concentrations of galaxies in space.
In combination with the image of the sky above, this allows the reconstruction
of the 3-dimensional structure traced by galaxies in the distant universe.
The green histogram shows the number of galaxies at each distance; the purple
histogram shows the expected distribution if the galaxies were arranged
randomly in space. The difference illustrates the very strong clustering of
the very distant galaxies. The presence of such strong clustering at early
times for the most luminous objects represents strong support for the
idea that galaxies form at the highest peaks in the distribution of matter;
these high peaks are themselves expected to be strongly correlated in space.
Over the age of the universe, gravity then amplifies these dense regions,
so that by the present day, they are likely to be the same regions where
rich clusters of galaxies are found. The details of the distribution of
early galaxies, and the nature of the galaxies themselves, are providing
critical tests of theories of galaxy and structure formation. They are
also showing that the relationship of visible galaxies to the overall
distribution of matter in the universe can be quite complicated,
and may be varying as a function of time; this
relationship must be quantified in order to fully understand what
the distribution of galaxies is telling us about the overall structure
of the universe. Thus, it is necessary to understand how galaxies form
in order to use them to trace the large scale structure of the universe.
A great deal of progress is being made in these areas, with much
more progress expected in the near future.


